MatPlotCheck Vignette Gallery
Below you will find a set of example applications for using MatPlotCheck to test plots to support autograding.
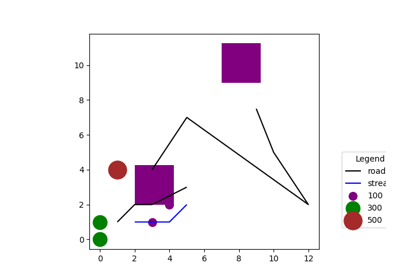
Test Plots of Vector Data (Created Using GeoPandas) with Matplotcheck
Test Plots of Vector Data (Created Using GeoPandas) with Matplotcheck